

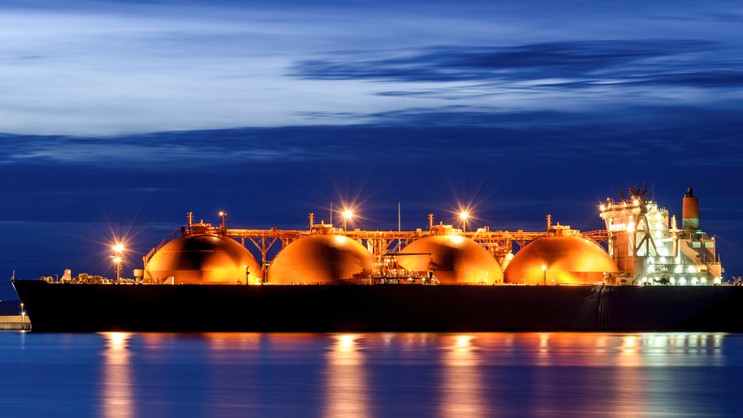
The United States emerged as the dominant force in global liquefied natural gas markets during 2025, according to data from the Energy Institute’s 2026 Statistical Review of World Energy. American LNG exports reached 5.2 trillion cubic feet, representing a 27% increase from 4.1 trillion cubic feet in 2024. This output accounted for approximately 1.10 trillion cubic feet of the 1.2 trillion cubic feet increase in global LNG supply, meaning the U.S. contributed roughly 93% of worldwide growth.
The American LNG industry’s expansion marks a dramatic transformation from a decade earlier. In 2015, the United States exported less than 0.03 trillion cubic feet of LNG. Qatar dominated the market at that time with 3.7 trillion cubic feet, while Australia contributed 1.4 trillion cubic feet. By 2025, the United States captured 25.4% of global market share, with Qatar at 3.9 trillion cubic feet and Australia at 3.7 trillion cubic feet. The shale revolution unlocked abundant, relatively low-cost natural gas reserves, while existing Gulf Coast infrastructure including pipelines, storage facilities, and ports accelerated the industry’s development. Plaquemines LNG and Corpus Christi Stage 3 were primary drivers of supply growth in 2025.
U.S. LNG exports demonstrated particular appeal due to their structural advantages. American contracts typically link to domestic natural gas prices and offer buyers flexibility to redirect cargoes to markets offering the highest returns. This mechanism proved especially valuable in 2025 as European demand increased while Asian demand softened amid trade tensions. American LNG shipments to Europe averaged a record 10.3 billion cubic feet per day, up from 6.3 billion cubic feet per day in 2024, comprising approximately 68% of total U.S. LNG exports.
Domestic production capabilities supported export growth without constraining domestic supply. U.S. natural gas production reached a record 103.9 billion cubic feet per day in 2025, while domestic consumption also set a record at 88.4 billion cubic feet per day. The Appalachia region remained the largest production source, though pipeline capacity constraints limit additional output movement. The Permian Basin and Haynesville regions contributed significant volumes, with geographic advantages positioning the Haynesville near Gulf Coast export terminals.
The International Energy Agency projects U.S. LNG exports will average approximately 17 billion cubic feet per day in 2026, with further increases expected in 2027 as additional capacity enters service. Projects totaling more than 2.8 trillion cubic feet of annual export capacity reached final investment decisions in 2025. The IEA estimates the United States will supply roughly one-third of the global LNG market by decade’s end. This expansion reflects broader market trends toward LNG trade, which now accounts for approximately 55% of interregional natural gas commerce compared with less than 40% a decade earlier.
Article Attribution | Read More at Article Source
Article summary produced by Claude AI