

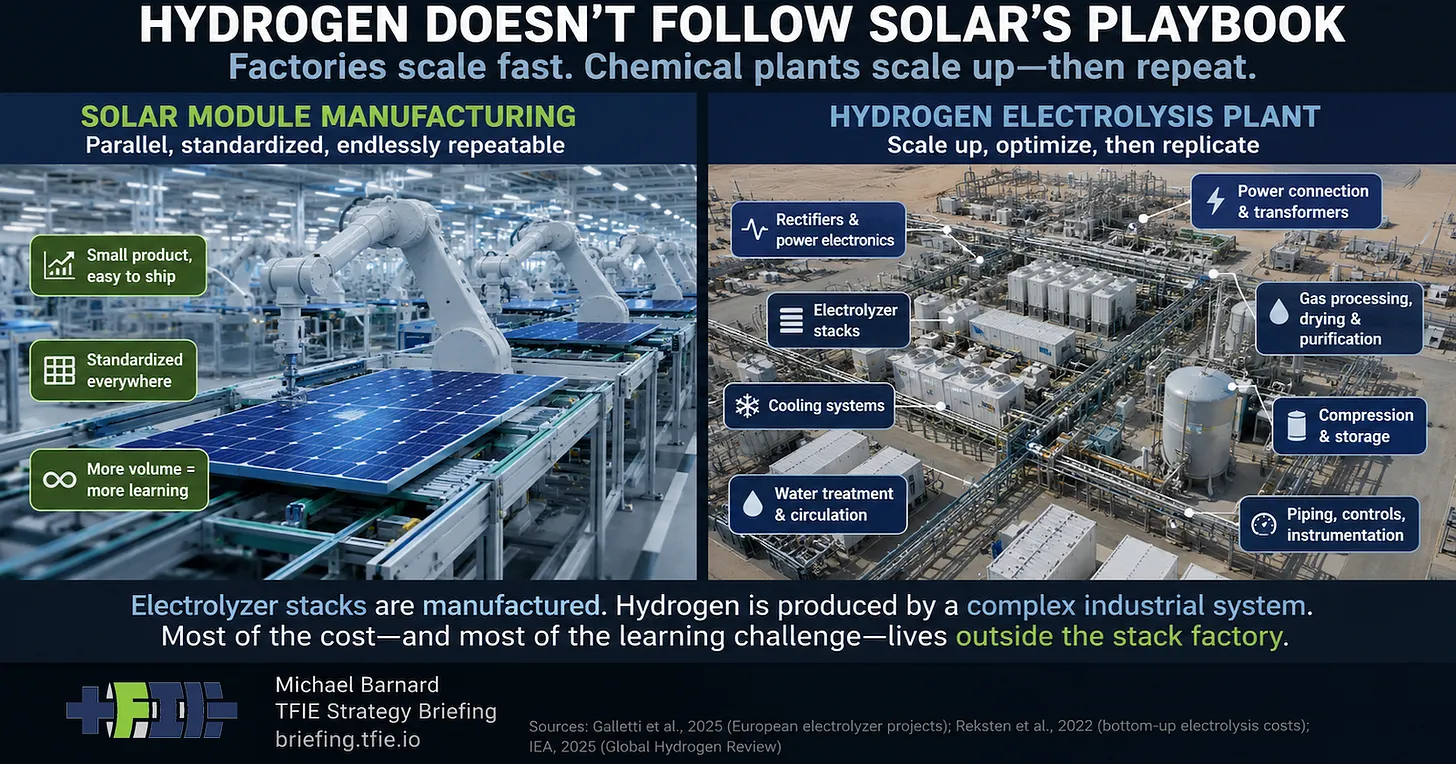
Analysts frequently apply experience curve methodology to hydrogen technology forecasts, projecting cost reductions based on historical learning rates tied to cumulative capacity deployments. However, recent research examining European electrolyzer projects reveals significant methodological challenges with this approach when applied to hydrogen systems.
A comprehensive 2025 study of European electrolyzer projects spanning from 2005 to the present identified apparent cost-reduction rates of 23.3% for all electrolyzer types, 32.1% for proton exchange membrane systems, and 22.9% for alkaline electrolysis per capacity doubling. These figures appeared competitive with historical cost curves for solar and battery technologies. Upon adjustment for project-size economies, however, the rates dropped substantially to 13.3%, 17.6%, and 7.3% respectively, with the alkaline relationship becoming statistically insignificant. The raw data had attributed multiple distinct cost-reduction mechanisms to a single “learning” phenomenon.
The core difficulty stems from what capacity doubling actually represents in hydrogen manufacturing. When cumulative installed capacity doubles, this growth may result from larger individual equipment units rather than proportionally more manufacturing iterations. If average electrolyzer stack sizes increase from 1 megawatt to 5 megawatts while total capacity expands tenfold, the number of completed stacks rises far less dramatically than installed gigawatts suggest, meaning factories gain less manufacturing experience than capacity metrics imply. Stack components including cells, membranes, and plates each accumulate separate manufacturing experience at different rates from finished equipment counts.
Additional constraints emerge from system boundaries and project architecture. Electrolyzer stacks represent only 15-20% of total installed project costs, with balance-of-plant equipment comprising 25-30% and engineering, procurement, and construction accounting for over half. Even substantial stack cost reductions therefore produce modest impacts on overall project expenses, while compressors, electrical systems, and construction follow independent productivity trajectories separate from electrolyzer manufacturing improvement rates.
Experience curve methodology captures several legitimate cost-reduction sources including improved stack designs, standardized engineering layouts, efficient procurement, and operational refinements. The analytical error occurs when these distinct mechanisms combine into a single historical learning rate applied mechanically to future projections. Much early cost reduction reflects one-time industry transition from demonstration to industrial scale rather than repeating manufacturing improvements. Electricity costs, which dominate hydrogen variable expenses, remain unaffected by manufacturing learning and introduce separate economic dynamics, as does compression, storage, and distribution infrastructure requiring different business models than modularized renewable energy components.
Article Attribution | Read More at Article Source
Article summary produced by Claude AI